Inspect HTTP exchange details
Capturing traffic is only half the job. The real value of an HTTP debugging proxy is what you can read once a request lands. In Fluxzy, every captured request and response pair is an exchange, and selecting one opens a detail view that breaks the exchange into focused tabs: the request and response content, the underlying connection, and a timing breakdown.
This guide walks through that detail view using one rich sample: a POST to httpbin.org/anything that carries a JSON body, a query string, a Bearer token and cookies. You will see how to read request and response headers, view a body formatted as JSON, inspect the query string, decode the Authorization (JWT) header, read connection information, and find where the time went in the timing breakdown.
TL;DR. Click any row in the exchange list to open it. The Exchange tab shows request and response side by side (headers, body, query string, authorization); the Connection tab shows the protocol, TLS and IP addresses; the Timings tab shows the latency breakdown. JSON and other structured bodies are rendered in a read-only Monaco editor with a formatted or raw toggle.
Platform note. The screenshots below are from the Windows app. The detail view is identical on macOS and Linux; only the window chrome differs.
What you need
- Fluxzy Desktop installed and running. If you have not captured anything yet, see Capturing HTTPS traffic.
- One captured exchange to inspect. Any traffic works. The sample below produces a request that is rich enough to exercise every tab.
The sample request
Fluxzy listens on its proxy port as soon as the app starts (shown in the status bar, commonly 0.0.0.0:44344), so you can record a request without starting a system-wide capture. Send a proxied POST with a JSON body, a query string, a Bearer token and a couple of cookies:
curl -x http://127.0.0.1:44344 -k \
  -X POST "https://httpbin.org/anything?role=admin&debug=true&trace_id=abc-123" \
  -H "Content-Type: application/json" \
  -H "Authorization: Bearer <your-jwt>" \
  -H "Accept: application/json" \
  -b "session=demo123; theme=dark; consent=granted" \
  --data '{ "orderId": "ORD-2024-88321", "customer": { "name": "Ada Lovelace" } }'
The -x flag routes curl through Fluxzy and -k accepts the Fluxzy certificate so HTTPS is decrypted. The exchange appears in the list within a second.
Open an exchange to inspect it
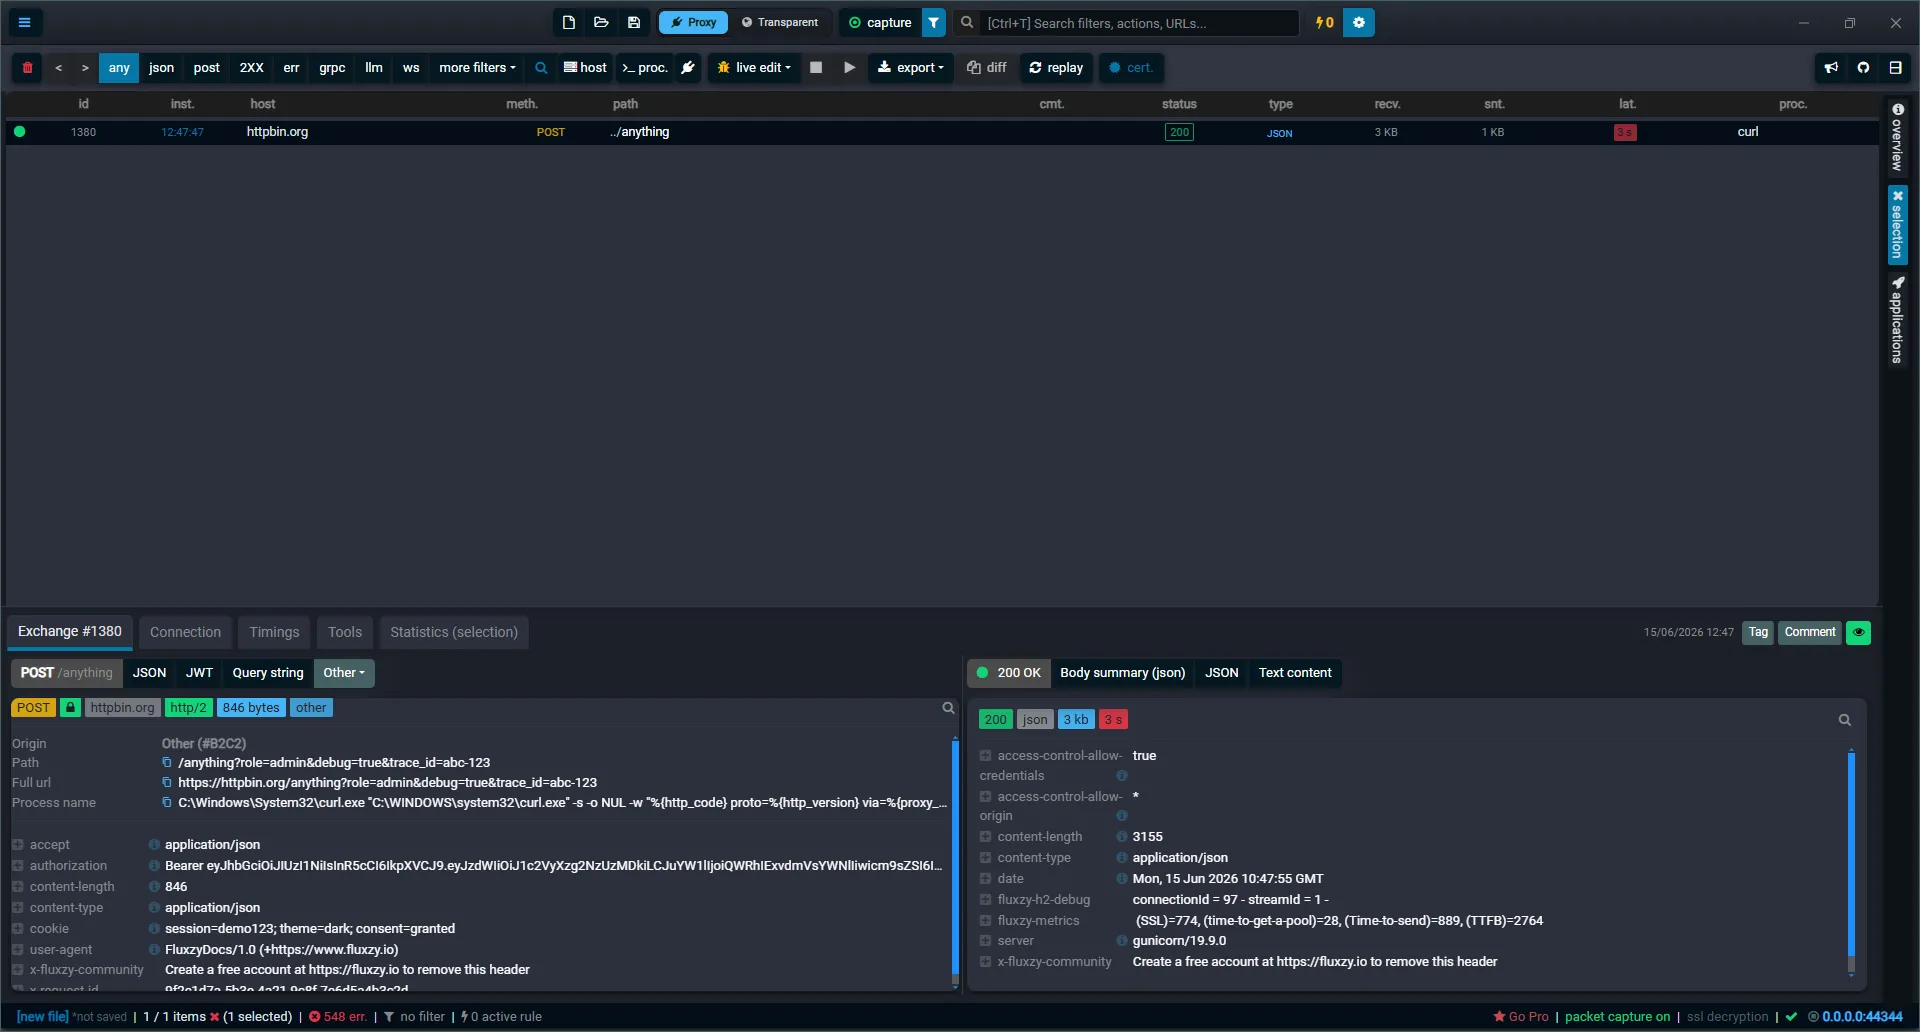
Click any row in the exchange list. The detail view opens in the second pane (below the list, or beside it, depending on your layout). A row of tabs sits at the top of the detail view:
- Exchange (with the exchange id, for example
Exchange #1380): request and response content. - Connection: the transport that carried the exchange (protocol, TLS, addresses).
- Timings: the latency breakdown.
- Tools: per-exchange utilities.
- Statistics (selection): aggregate numbers across the exchanges you have selected.
The Exchange tab is selected by default and shows the request on the left and the response on the right. On the far right of the detail header you can Tag the exchange, attach a Comment, or use the eye icon to Show in exchange table (jump back to its row in the list).
Read the request and response headers
The Exchange tab opens on the headers by default. The first button on each side (the request method and path on the left, the status code on the right) is the header view.
On the request side (left) you get:
- A summary line of badges: the method, the host, the negotiated protocol (
http/2here), and the request body size. - The request line: Path, Full url and the Process name that produced the request (the curl command in this example), each with a copy button.
- Every request header, including
authorization(theBearertoken),content-type,cookieanduser-agent.
On the response side (right) you get the status code badges (status, content type, body size, duration) and every response header, such as content-type: application/json, content-length, server, and Fluxzy's own fluxzy-metrics header that echoes the key timings.
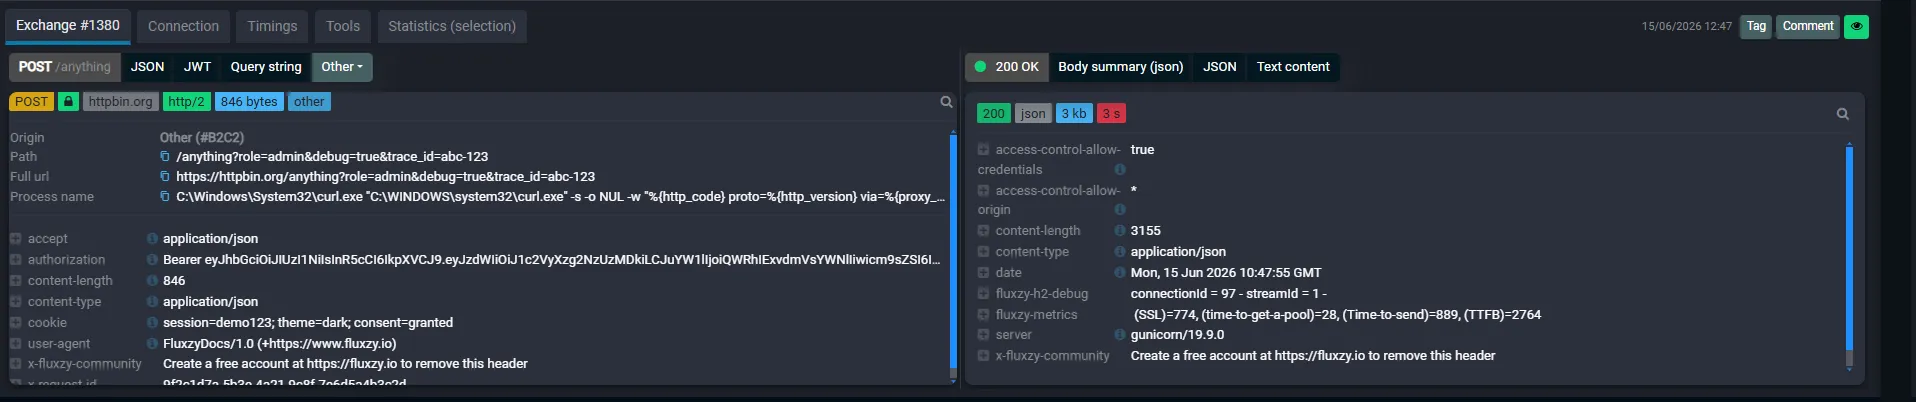
Tip: use the format buttons next to the header button to switch the same side to a different view of the request or response (for example JSON, Query string, or JWT, described below). The Other dropdown holds additional views such as the raw HTTP/1.1-style header text.
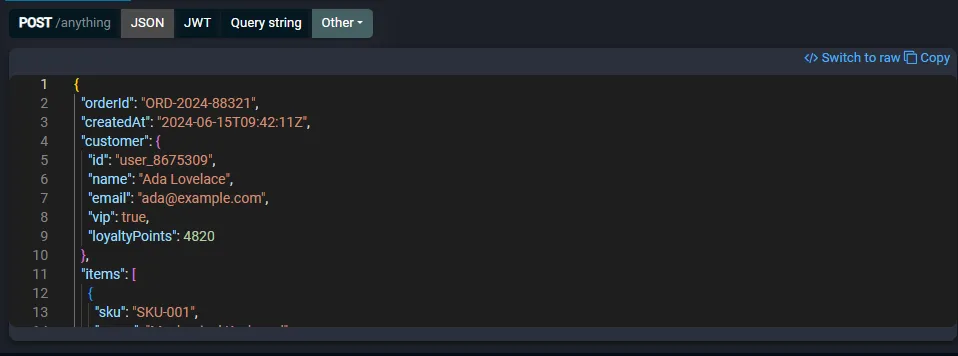
View the body as formatted JSON (Monaco editor)
When a body is JSON, Fluxzy adds a JSON view that renders it in a read-only Monaco editor (the same engine that powers VS Code): line numbers, syntax highlighting, folding and word wrap.
Select the JSON button on the request side to see the request payload, pretty-printed:
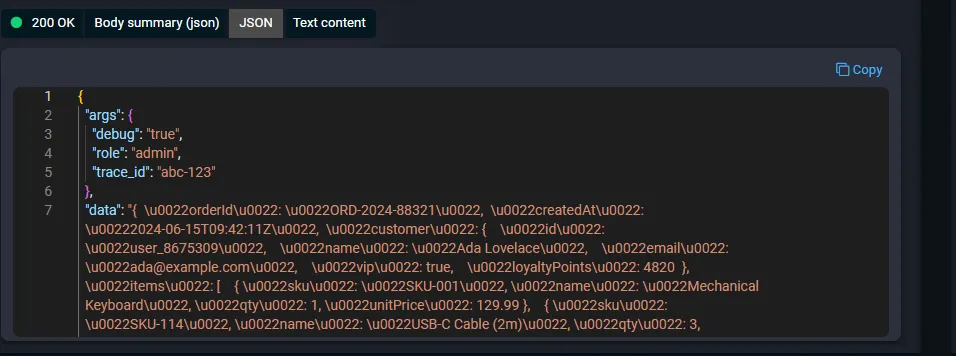
Select the JSON button on the response side to see the response payload. Here httpbin echoes the request back, so the response JSON contains the query string (args) and the body you sent (data):
Fluxzy also formats other structured content types, so XML, form-encoded and multipart bodies get the same readable treatment. For multipart form data you can download each uploaded file back from the panel.
Format, switch to raw, and copy
Two controls sit at the top right of the body viewer:
- Switch to raw toggles between the pretty-printed JSON and the body exactly as it was sent on the wire. Click it again (Switch to formatted) to go back. This appears whenever Fluxzy reformatted the body, so you can always confirm what really crossed the network.
- Copy puts the displayed body on your clipboard.
The editor is read-only here. To change a body and send it again, use a breakpoint or replay.
Inspect the query string
The Query string view breaks the URL query into a name and value table, which is far easier to scan than a long URL. The sample request used ?role=admin&debug=true&trace_id=abc-123:
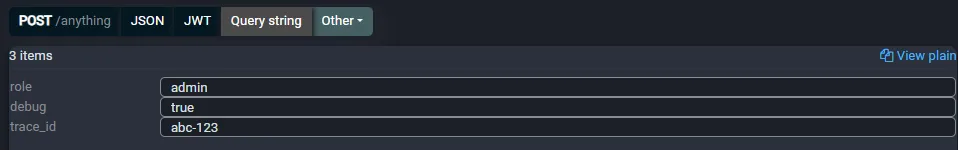
Use View plain to switch back to the raw query string.
Decode the Authorization (JWT) header
When a request carries a Bearer token that is a JSON Web Token, Fluxzy adds a JWT view that decodes it for you. There is no need to paste the token into an external decoder.
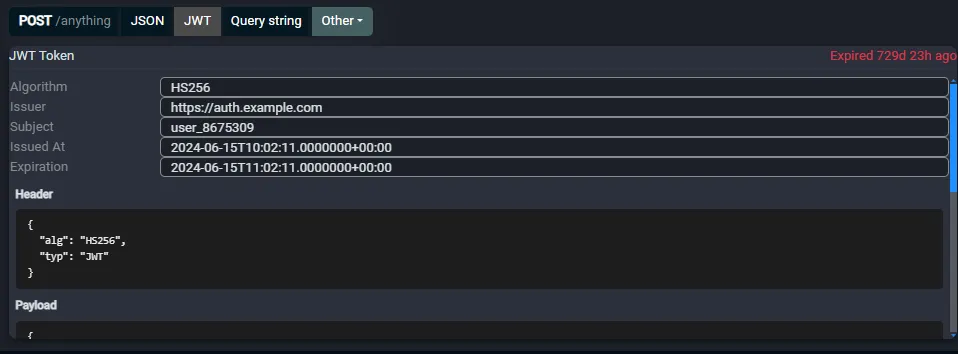
It surfaces the key claims (Algorithm, Issuer, Subject, Issued At and Expiration), flags an expired token in red, and shows the decoded Header and Payload as JSON. This makes it quick to confirm which identity, scopes and expiry a request was sent with. For more on this, see Decode JWT tokens.
Basic authentication is decoded the same way, and cookies are stripped from the headers into their own readable list.
View connection information: protocol, TLS and IP addresses
The Connection tab describes the transport that carried the exchange. One connection is often reused by many exchanges, so this tab is shared by all of them.
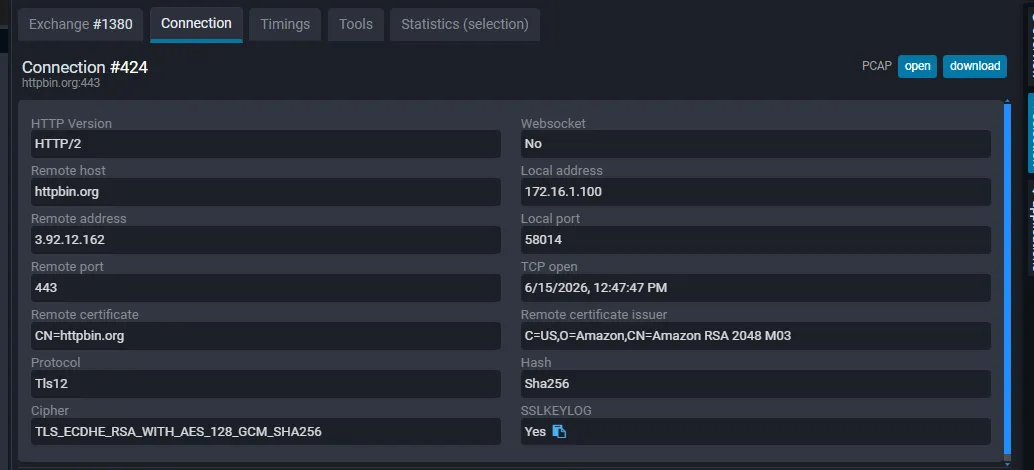
The left panel lists:
- HTTP Version: the protocol negotiated with the server (
HTTP/2here, even though the local curl client spoke HTTP/1.1 to the proxy; Fluxzy negotiates its own protocol with the origin). - Websocket: whether the connection was upgraded to WebSocket.
- Remote host, Remote address and Remote port: the server name, its resolved IP, and the port (
httpbin.org,3.92.12.162,443). - Local address and Local port: the source IP and ephemeral port Fluxzy used.
- TCP open: when the socket was opened.
- TLS details: the Remote certificate subject (
CN=httpbin.org) and its issuer, the negotiated Protocol (Tls12), the Hash (Sha256) and the full Cipher suite (TLS_ECDHE_RSA_WITH_AES_128_GCM_SHA256). - SSLKEYLOG: when a raw packet capture is recording, the session keys are available (with a copy button) so you can decrypt the capture in Wireshark.
The PCAP buttons (open and download) export the raw packet capture for this connection as a .pcapng file. The right panel lists the other Exchanges in this connection and lets you filter them into the main view, which is useful to see whether a connection was reused or a new one was opened. See Capture raw packets (PCAP) for how to enable packet capture.
View timings: where the time went
The Timings tab breaks the exchange into phases so you can see exactly where time was spent.
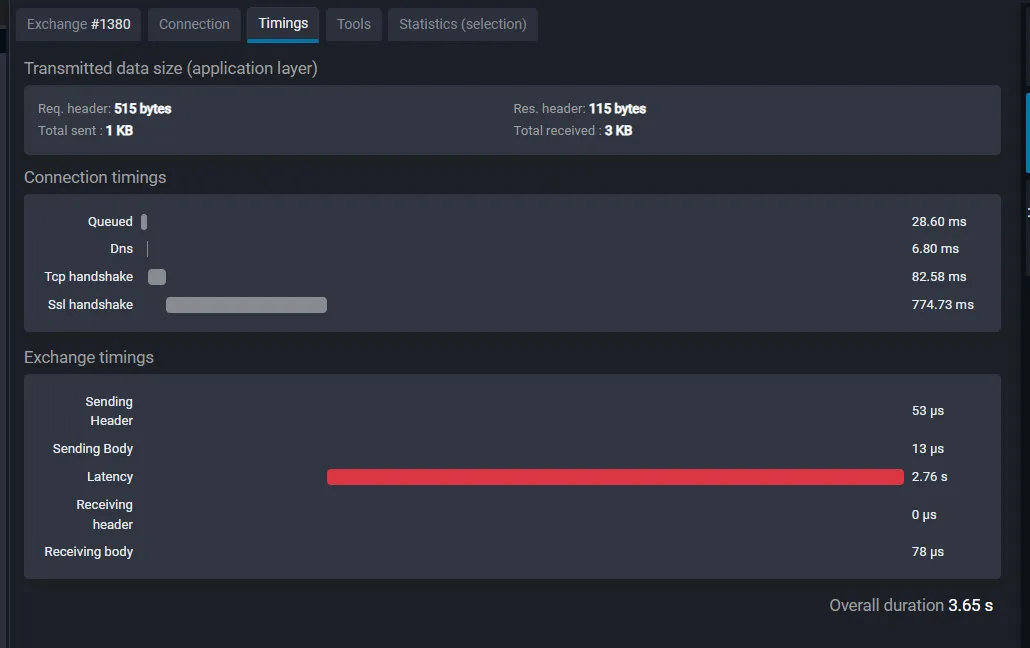
It has three groups:
- Transmitted data size (application layer): request and response header sizes, plus total bytes sent and received.
- Connection timings: the one-time cost of establishing the connection, shown only when this exchange opened it. Queued (waiting for a connection slot), Dns (name resolution), Tcp handshake, and Ssl handshake (the TLS negotiation).
- Exchange timings: the request and response themselves. Sending Header, Sending Body, Latency (the wait for the first response byte, also known as time to first byte or TTFB), Receiving header, and Receiving body.
Each row has a proportional bar, so the bottleneck is obvious at a glance. In the sample, the Ssl handshake (about 775 ms) and the server Latency (about 2.76 s) dominate, and the Overall duration is about 3.65 s.
When an exchange reuses an existing connection, the connection timings are greyed out and excluded from the overall duration, because that setup cost was already paid by an earlier exchange.
Tools and selection statistics
- Tools groups per-exchange utilities: export the request as a cURL command (cmd, bash or Postman), replay the request with or without live edit, save the request and response bodies (optionally stripping transfer encoding and compression), and export to HAR or another network format.
- Statistics (selection) aggregates numbers (counts, durations, bytes) across all the exchanges you currently have selected, which is useful for measuring a whole page load rather than a single request.
Frequently asked questions
How do I view the raw, unformatted body?
Open the body in the JSON (or other structured) view and click Switch to raw at the top right. You then see the bytes exactly as they crossed the wire. Switch to formatted returns to the pretty-printed view.
Why does the Connection tab show HTTP/2 when my client used HTTP/1.1?
Fluxzy is a man-in-the-middle proxy: it terminates the client connection and opens its own connection to the origin server. The HTTP Version on the Connection tab is the protocol Fluxzy negotiated with the server, which can differ from what your local client used to reach the proxy.
Can I edit a request or response from the detail view?
The body and header viewers are read-only. To change traffic, pause it with a breakpoint and edit it live, or replay the request with modifications. The detail view is for inspection.
What does the time to first byte (Latency) include?
Latency is the gap between sending the request and receiving the first byte of the response. It mostly reflects server processing time and network round-trip, and it is usually the largest part of a slow exchange.
Can I decrypt the connection's packet capture in Wireshark?
Yes. When raw packet capture is enabled, the Connection tab exposes the TLS session keys (SSLKEYLOG) and the PCAP download. Load both into Wireshark to inspect the decrypted packets.
Next steps
- Filter and search the exchange list to isolate one host, process, or status code, then inspect the survivors.
- Export as a cURL command (right-click a row) to reproduce a request from the terminal.
- Compare two exchanges to diff their headers and bodies side by side.
- Replay a request to reproduce a bug or verify a fix.