Explore exchange details
Fluxzy Desktop lets you explore all the details of an exchange. This includes the request and response headers, the request and response bodies, and the timing and performance information.
To explore an exchange, select any exchanges on the left panel.
The right panel will display various option to explore the exchange.
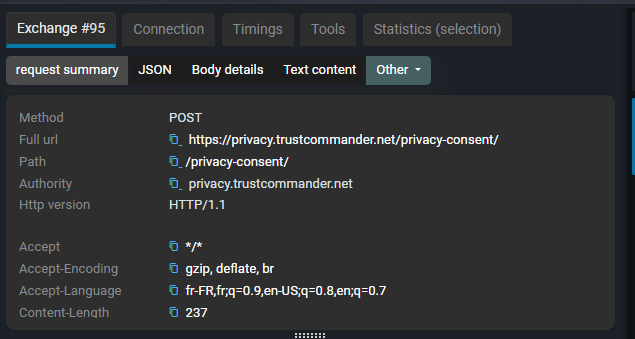
Exchange tab
The exchange tab shows straightforward details about request and response.
- request and response summary displays the main property of the exchange: method, path, protocol, status code and all headers.
- according to the request and response body content type, the right panel will display the body content in a readable format.
- Authorization headers: basic authorization and bearer token are decoded and displayed in the right panel.
- From content: Whether it's a form url encoded or a multipart form, the right panel will display the form content in a readable format. You will be able to download back the file if it's a multipart form.
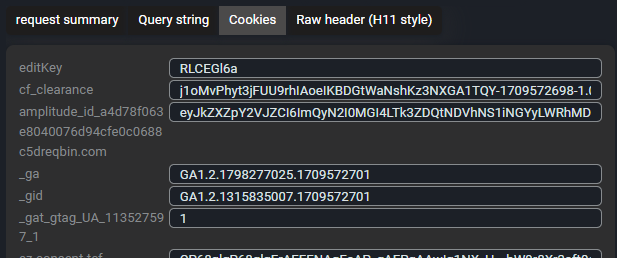
- Cookies: Cookies are stripped from the headers and displayed in the right panel.
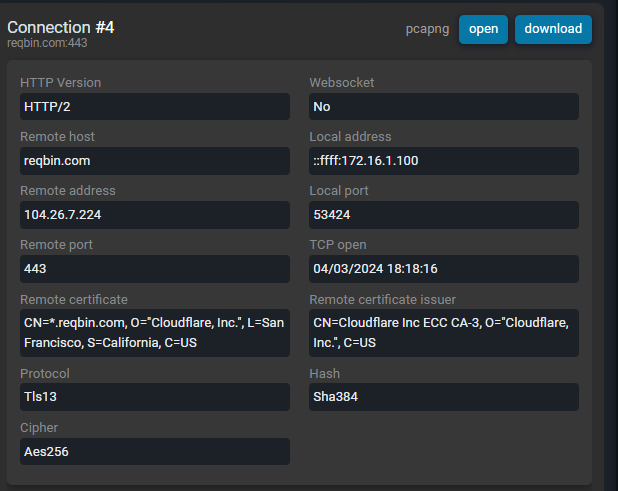
Connection tab
Connection tab shows details of the transport connection used for the exchange. You can view the connection details, the SSL/TLS certificate from client and server, and the SSL/TLS handshake details, the source and destination IP and port, and the transport protocol used.
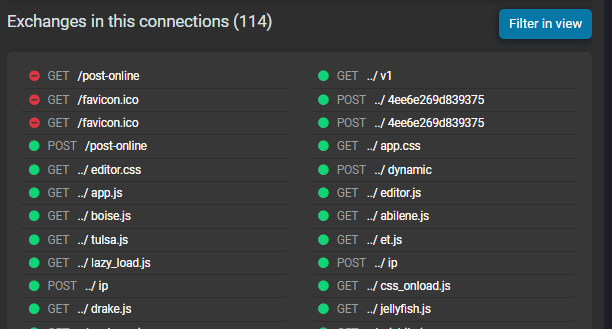
From the same tab, you can view any exchanges that used the same transport connection. This is useful to see if the connection was reused or if a new connection was created for the exchange.
You can also download the capture PCAPNG file of the connection. This is useful to analyze the network traffic in a dedicated tool like Wireshark.
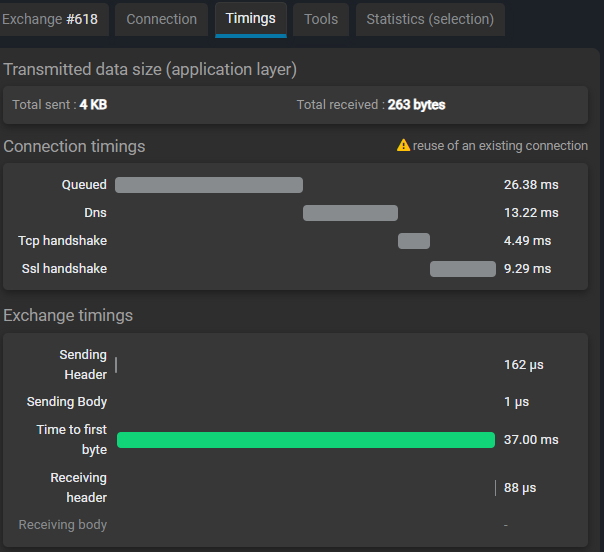
Timing tab
Timing tab shows performance detail on the current exchange. It's focused on the time spent on the network and the server side and detail why the current select exchange takes that long to complete.
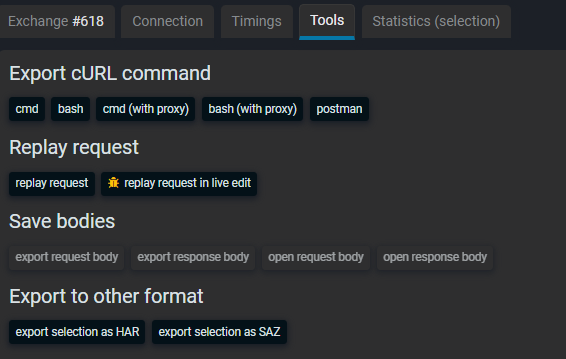
Tools
Tools tab contains various command to help you debug the exchange. It contains:
- Starting point to export cURL commands in various shell (cmd, bash and postman)
- Access to replay the selected request, including passing through the live edit tool.
- Access to save request and response bodies with the option to stripe any transfer encoding and compression made to the content.
- Access to export the current exchange to HAR file or other network format