An offline tauri-based Http Debugger
Fluxzy Desktop is a fully offline HTTP/HTTPS debugger for Windows, macOS, and Linux. Capture and inspect plain and encrypted traffic across HTTP/1.1, HTTP/2, WebSocket, and gRPC, with no data ever leaving your machine.
From live traffic modification rules to deep protocol inspection, Fluxzy puts you in control of your network layer. Export to HAR, PCAPNG, or Fluxzy's native format. Built on the open-source fluxzy.core engine, and trusted by developers worldwide.
Get Fluxzy Desktop Community Edition
Discover Fluxzy Desktop free with the Community Edition. All features are fully unlocked for personal use and evaluation, so you can explore everything Fluxzy has to offer before committing.
What can you do with Fluxzy?
| Feature | Description |
|---|---|
| Capture & Filter Traffic | Search and filter HTTP/HTTPS traffic by URL, headers, content type, status codes, cookies, or custom patterns with regex support |
| Mock & Modify Requests | Change URLs, methods, headers, inject authentication, or impersonate browsers before requests reach servers |
| Mock & Modify Responses | Return custom responses, inject HTML/JavaScript, modify headers, or serve local files instead of remote content |
| Manipulate DNS & Routing | Redirect traffic to different IPs, chain upstream proxies, or use DNS-over-HTTPS |
| Control SSL/TLS | Decrypt HTTPS traffic with built-in or custom certificates, use client certificates, or bypass specific connections |
| Simulate Network Conditions | Add latency, throttle bandwidth, or block requests to test under poor network conditions |
| Browser Impersonation | Mimic specific browsers with TLS fingerprinting and header profiles for testing |
| Session Management | Capture and replay authentication cookies and headers across requests |
| Track Process Origins | Identify which application or process generated each request |
| Interactive Debugging | Set breakpoints to pause and manually inspect or modify traffic in real-time |
| Tag & Annotate | Add comments and colored tags to organize and document captured exchanges |
| Export Data | Save captures as HAR, Fiddler SAZ, PCAPNG for Wireshark, cURL commands, or native .fxzy format |
| Script & Automate | Create custom filters and rules using external scripts for advanced automation |
Installation
Installing Fluxzy Desktop is simple:
- Windows & macOS: Launch the installer and proceed with the guided setup just a few clicks, and you're ready to go.
- Linux: Install using the provided .deb (Debian-based) or .rpm (Fedora-based) package for seamless integration.
- Standalone Version: A portable ZIP file is available for all platforms - just extract and run, no installation required.
Windows and macOS binaries are signed with the Fluxzy SAS certificate, ensuring that the software is genuine and has not been tampered with.
An overview of the interface
Toolbars

The toolbar is located at the top of the application window. It provides quick access to the main features of Fluxzy Desktop.
Menu access
![]()
Cross-platform menu access is available from the top left corner of the application. In macOS, the menu is located in the top bar of the screen as per the macOS guidelines.
Capture button
The capture button triggered OS capture or source filtered OS capture.
Search everywhere block
![]()
Search everywhere block navigates to any part of the application. It is accessible by pressing Ctrl+T or Cmd+T on macOS. Search everywhere block gives keyword access to: settings, filter management, rule management, browser capture launch, OS capture, and more.
View filters
![]()
View filters give quick access to most common used filter such as JSON content, POST method, 2XX status code, error status code, and more.
Live edit toolbar
![]()
Live edit toolbar gives quick access to HTTP debugging tools and breakpoints such as:
- Halting on going request
- Setting a filter on live edit
- Clearing filters
- Step into the next request
Exchange Table
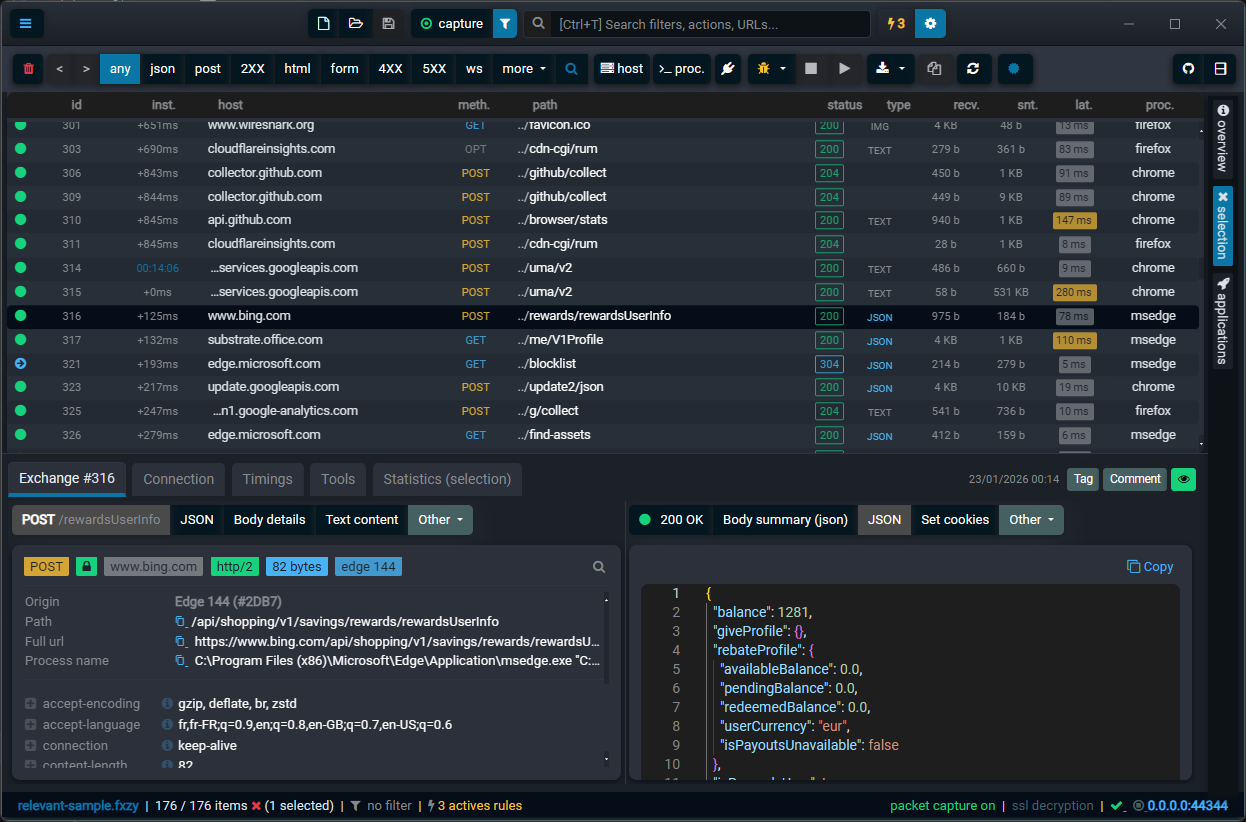
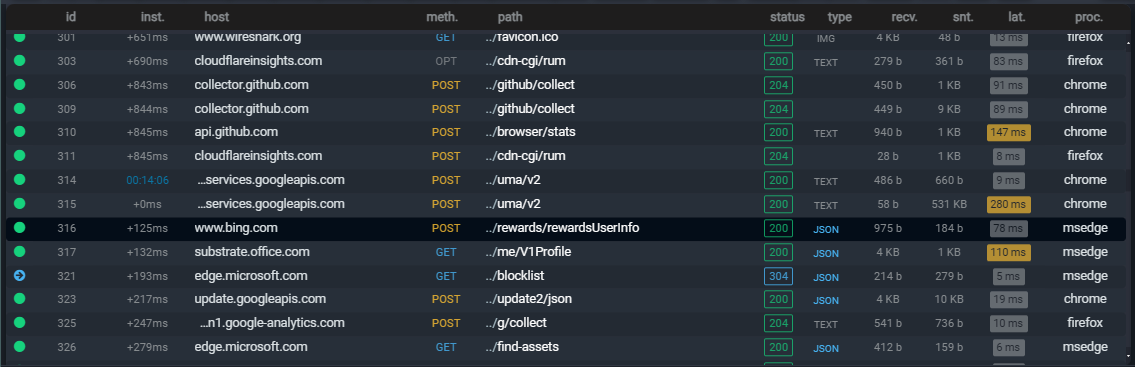
The exchange table serves as the central interface of Fluxzy Desktop, functioning as the primary workspace where users interact with captured network traffic. It displays every HTTP request/response pair (referred to as an "exchange") flowing through the proxy in real-time.
Each row in the table represents a complete network round-trip: a request sent to a server and the corresponding response received. This provides a comprehensive overview of all network conversations between monitored applications and remote servers.
Displayed Information
The table columns present essential information for each exchange at a glance:
| Column | Description |
|---|---|
| Host | The destination hostname |
| Path | The requested endpoint URL path |
| Method | The HTTP method (GET, POST, PUT, DELETE, etc.) |
| Status Code | The response status code indicating success or failure |
| Content Type | The response format (JSON, HTML, XML, images, etc.) |
| Size | The response payload size |
| Duration | The total request/response time |
| Process | The originating application (when process tracking is enabled) |
 Users may customize the displayed columns, adjust their order, and modify column widths according to their preferences.
Filtering Capabilities
The exchange table integrates directly with Fluxzy's comprehensive filtering system. Right-clicking on any value within the table allows users to instantly filter the view to display only matching exchanges. Filters may be combined using AND logic (Ctrl+click) or OR logic (Shift+click), and filter history navigation enables quick switching between different filtered views.
Available Actions
Selecting one or more exchanges provides access to several operations:
- Compare two exchanges in a side-by-side diff view
- Export selected exchanges as cURL commands, HAR files, or other supported formats
- Set breakpoints on specific URLs for live debugging sessions
- Create rules targeting similar traffic patterns
- Copy request details to the clipboard
Role in the Workflow
The exchange table functions as the primary entry point for network investigation and debugging workflows. Users identify anomalies or points of interest within the table, then navigate to detailed views for full header and body inspection, create modification rules for matching traffic, or establish breakpoints for interactive debugging sessions.
Right panel
Right panel is the main panel of the application. It shows the content of the request and the response that's currently selected in the left panel.
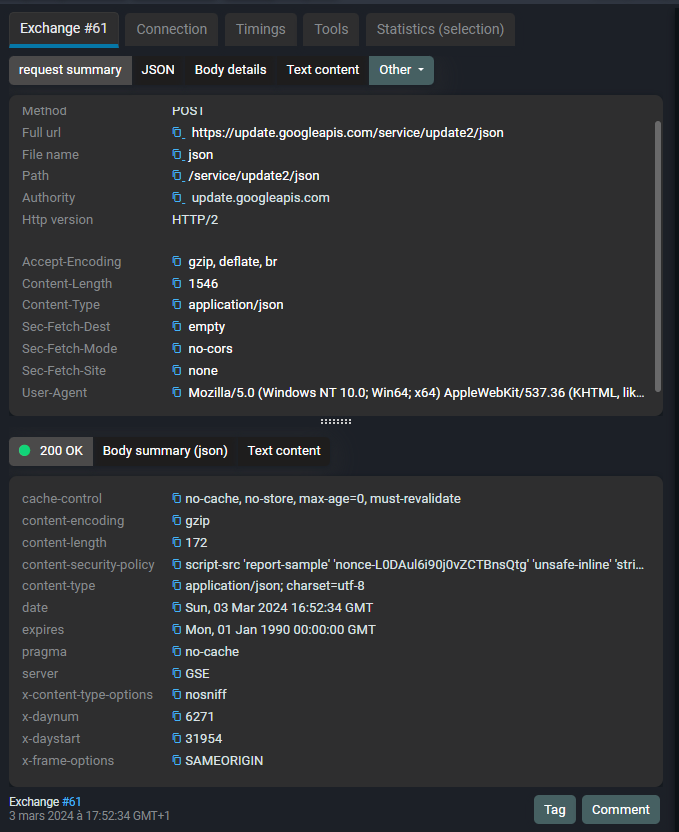
You can explore through the right panel various properties of the current captured request such as: request and response headers, request and response bodies, and the timing and performance information.
The bottom part of the right panel gives you acces to add metadatas to the current selected request. Metadatas can be comment inserted by the user, or tags that can be used to filter the request.
Overview panel
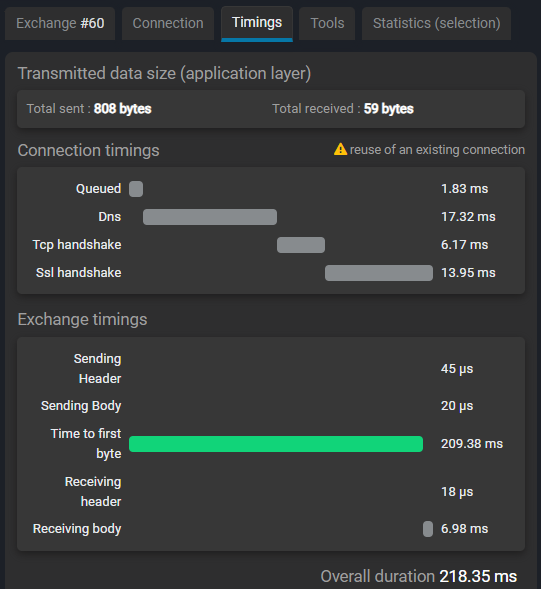
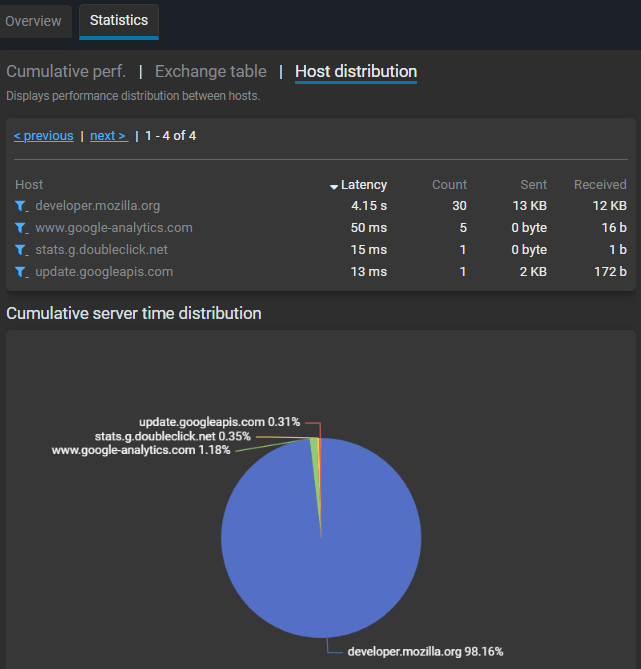
Overview panel gives a quick performance and statistics view of the currently shown request. You can access to this panel by clicking on the Overview tab in the right panel.
![]()
Overview panel leads to a quick view, statistics focused of the current request in the filter view. It helps the user to isolate quickly request generating bottlenecks in terms of performance.
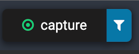
Status bar
Status bar gives a quick view of the current state of the application. It shows the current state of the proxy, the current active rule, and the current active filter.
![]()
Additionally, it gives quick access to the capture button, the filter mangement dialog, and the rule active dialog box.
Inspector
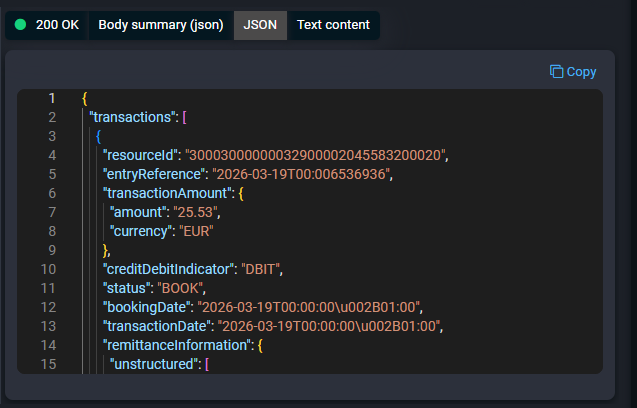
Built-in inspector are available depending on the actual content type of the request or the. For example, if the request contains a JSON body, a JSON inspector will be available to explore the JSON content in a tree view. If the request contains an HTML body, an HTML inspector will be available to explore the HTML content in a rendered view. Code are rendered using Monaco editor with syntax highlighting and formatting. Fluxzy Desktop can handle complex type like proto or JWT to help improve your API debugging experience.
Example 1 : JSON inspection with Monaco editor
You can use Ctrl+Shift+P to open the command palette and search for "Toggle JSON inspector" to open the JSON inspector for the current request.
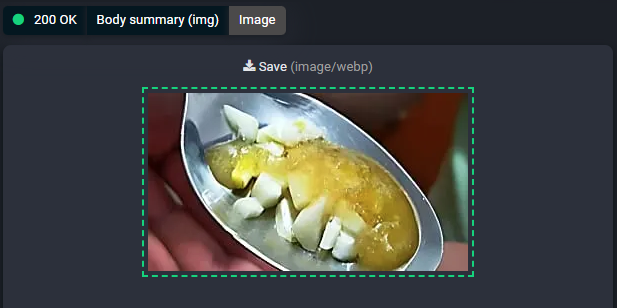
Example 2 : Picture rendering
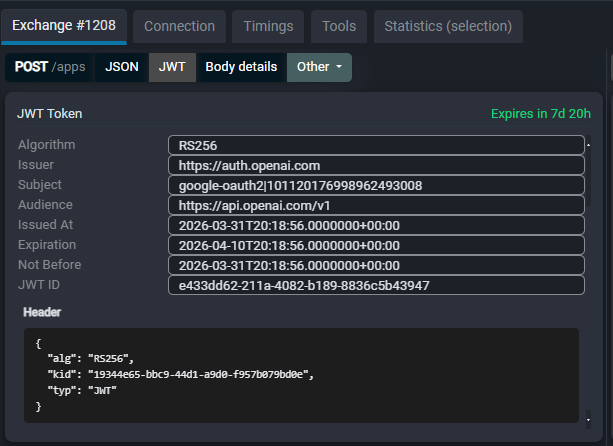
Example 3 : JWT automatic decoding in the inspector.
JWT are automatically detected and decoded in the inspector. You can click on the decoded JWT to open a detailed view of the header and the payload (and all the claims) of the JWT.
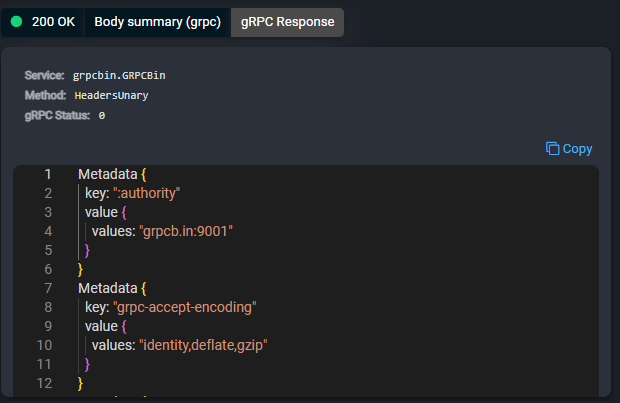
Example 4 : gRPC inspector
When gRPC traffic is detected, a gRPC inspector is available to explore the gRPC request and response in a structured way. If proto files are provided, the gRPC inspector will use them to decode the protobuf messages with full field names and types. To provide proto files, you can go to the settings and set the path to your proto files directory under "Capture options" -> "Proto directories".