How to debug LLM API calls from your AI agent
If you are building an AI agent in 2026, you have probably hit this wall: the agent starts looping, burns through tokens, or behaves in ways you cannot explain, and you have no clear view of what it actually sent to the LLM. The framework gives you a summary. It does not give you the raw request.
This post walks through how to see the real API calls your agent makes, including the exact system prompt, the declared tools, the token usage, and the tool calls coming back. It works the same way whether you are using a framework like langgraph or langchain, or a coding agent like Claude Code, Codex, or Gemini CLI.
Why framework logs are not enough
Most agent frameworks give you their own view of what happened: agent called tool X, got result Y, moved on. That is useful for following the logic, but it is a summary, not the wire.
What you usually cannot see from those logs:
- The literal JSON request body that hit the API, which is the thing that actually costs you tokens.
- The full system prompt and tool schemas being re-sent on every turn.
- What a subagent sent, since subagents spawn their own calls that never surface where you are looking.
- The response the model actually returned, including stop reason and token usage, before the framework reshaped it.
When an agent loops, the answer to why is almost always in that raw request and response. So that is what you want to look at.
The approach: intercept the calls instead of instrumenting your code
Every agent framework, no matter how the abstraction looks, eventually does the same thing at the bottom: an HTTPS request to a chat completions endpoint with a specific JSON shape. langgraph, langchain, a hand-rolled loop, Claude Code, Codex, Gemini CLI: same wire format underneath.
That means you do not have to add logging inside each framework. You can sit between the agent and the API with a man-in-the-middle proxy and read the traffic directly. This operates one layer below the framework, so it is framework-agnostic by construction. Change frameworks tomorrow and the setup still works.
This is the same MITM proxy technique developers have used to debug web and mobile traffic for years. The part that matters for LLMs is parsing the provider-specific payloads into something readable, especially streamed responses, where the body arrives as a stream of SSE chunks that have to be reassembled before any of it makes sense.
How to debug LLM API calls with Fluxzy
Here is the concrete setup using Fluxzy Desktop.
Prerequisite: turn on full decryption
LLM API traffic is HTTPS, so the proxy has to decrypt it to show you the contents. In Fluxzy Desktop, make sure full decryption is enabled before you start. Without it, you will see the connection but not the request and response bodies, which is the part you actually want.
Launch a hooked console
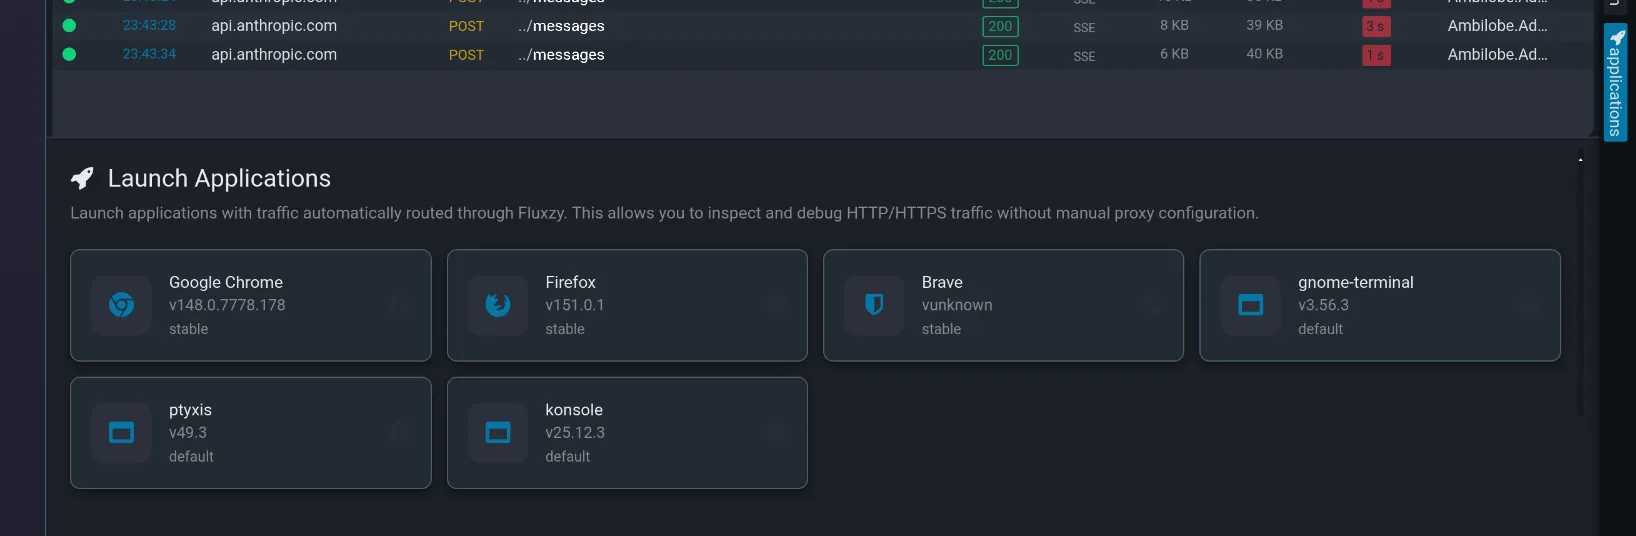
If your agent runs from a console (bash, zsh, cmd), use Fluxzy's run and hook feature to start a hooked shell. Everything launched from that shell routes its traffic through the proxy automatically, with no code changes and no manual environment setup.
Run your agent and watch the calls
Run your agent the way you normally would. Every LLM call shows up as it happens, ready to inspect.
What you can see in each request and response
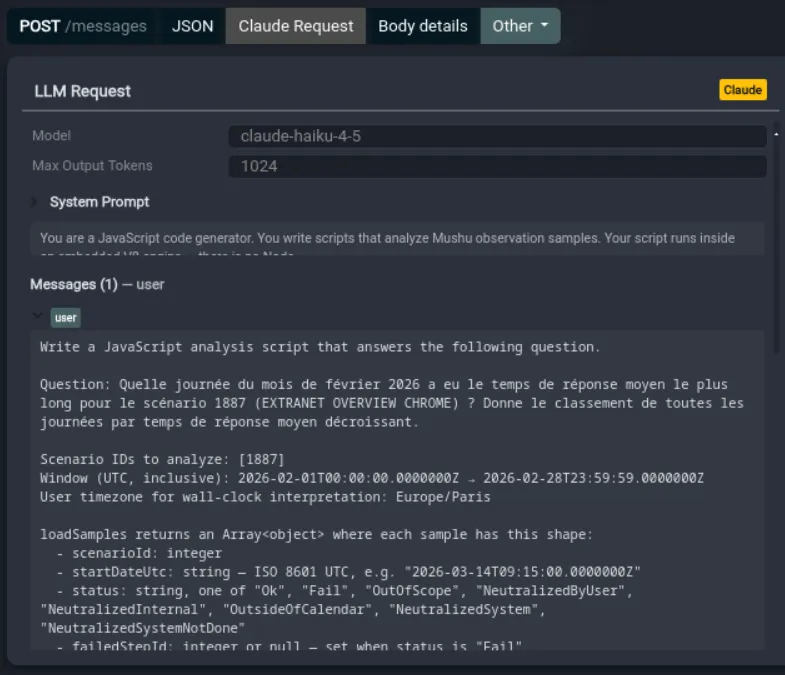
For each request:
- Model requested
- Max output tokens
- Whether streaming is on
- The full system prompt
- Every user and assistant message in the conversation
- The tools declared, with each tool's full schema and description
- Prior tool results being fed back in
For each response:
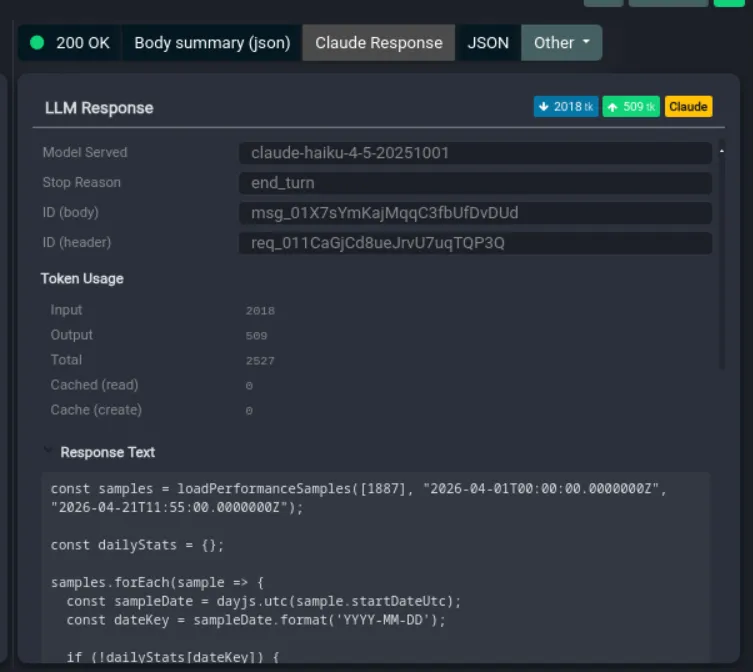
- The model actually served, which is not always the one you asked for
- Stop reason (end_turn, tool_use, and so on)
- Token usage
- Which tools the model called, with what arguments, and the result
Works with Claude Code, Codex, and Gemini CLI
Because the technique reads the wire and not the framework, it covers the popular coding agents as well as custom agents. You can debug:
- Claude Code
- Codex
- Gemini CLI
- Any agent built on langgraph, langchain, the Microsoft agent framework, or your own loop
The common factor is the API call. If your agent makes one, you can see it.
What this is good for
The main payoff is that when an agent misbehaves, you stop guessing. You can see exactly what went out, what came back, and where the tokens went. Common things this surfaces:
- A tool schema or system prompt being re-sent on every single turn, quietly multiplying your input token cost across a long run.
- A request payload that is far less token-friendly than you assumed.
- A loop where the same call repeats with almost identical input.
- A model silently falling back to a different one than you requested.
A note on security
Intercepting the calls means decrypting your own API traffic, which includes your API keys in the request headers. That is fine on your own machine where you control the proxy, but it is worth being aware of: do this locally, on traffic you own, and do not point it at anything you would not want to read in plaintext.
Summary
Debugging an AI agent does not have to mean trusting the framework's summary. By intercepting the raw LLM API calls with a proxy, you get the actual requests and responses: system prompt, tools, token usage, and tool calls, across any framework or coding agent. Turn on full decryption, launch a hooked console, run your agent, and watch.